


One of the best parts of working on innovation projects is meeting inspiring people who pursue ideas revolutionizing industries in ways that only a few years ago seemed impossible.
What if you could create a precise, real-time map of the traffic on your country’s roads and present it in a way anyone can understand?
Traffic management revolution seems apt.
Make way for the RODOS Transport Systems Development Centre, a platform of professionals from academia, private companies as well as public administration working in applied transport research with a specific focus on road transport monitoring and control. In other words, they make it easier and faster for you and I to get around, in the Czech Republic.
The centre uses three primary data sources: floating car data obtained from three fleets, covering about 5% of the traffic flow; an electronic toll system covering over 1000 km-s of motorways producing over 7 million transaction data every day; and classic detector networks such as radars and cameras. All these are fed into Salomon, a supercomputer that then analyses and interprets the various data and produces information and insight of the nation’s roads.
Take a breather. It’s clear that the data fed into the analysing computer are varied, come in large amounts and have high velocity. Or in other words, they qualify as ‘Big’ in Big Data terms. The supercomputer analysis could be complemented with big data components, for improved and scalable analysis, interpretation and visualisation. In essence the use of selected Big Data technologies could support the smooth and swift integration of data streamed from the three different sources (variety), and enable the analysis of much larger (volume) and more dynamic (velocity) data streams more efficiently, with unprecedented possibilities to uncover trends, correlations and patterns.
The benefits of enhancing the RODOS platform with Big Data can be summarised as follows:
- Use of tried and tested high-performance (volume, speed) technology that can handle the expected volumes and data change rates for the three data sources.
- Adherence to standard data and knowledge representation models that can tackle the variety issue by providing for a standard representation format which can be used to ingest and harmonise input from different data sources.
- Adhering to interoperable components in the Big Data technology stack ensures that one or more Data Value Chains behind such a project are easier to realise and attain.
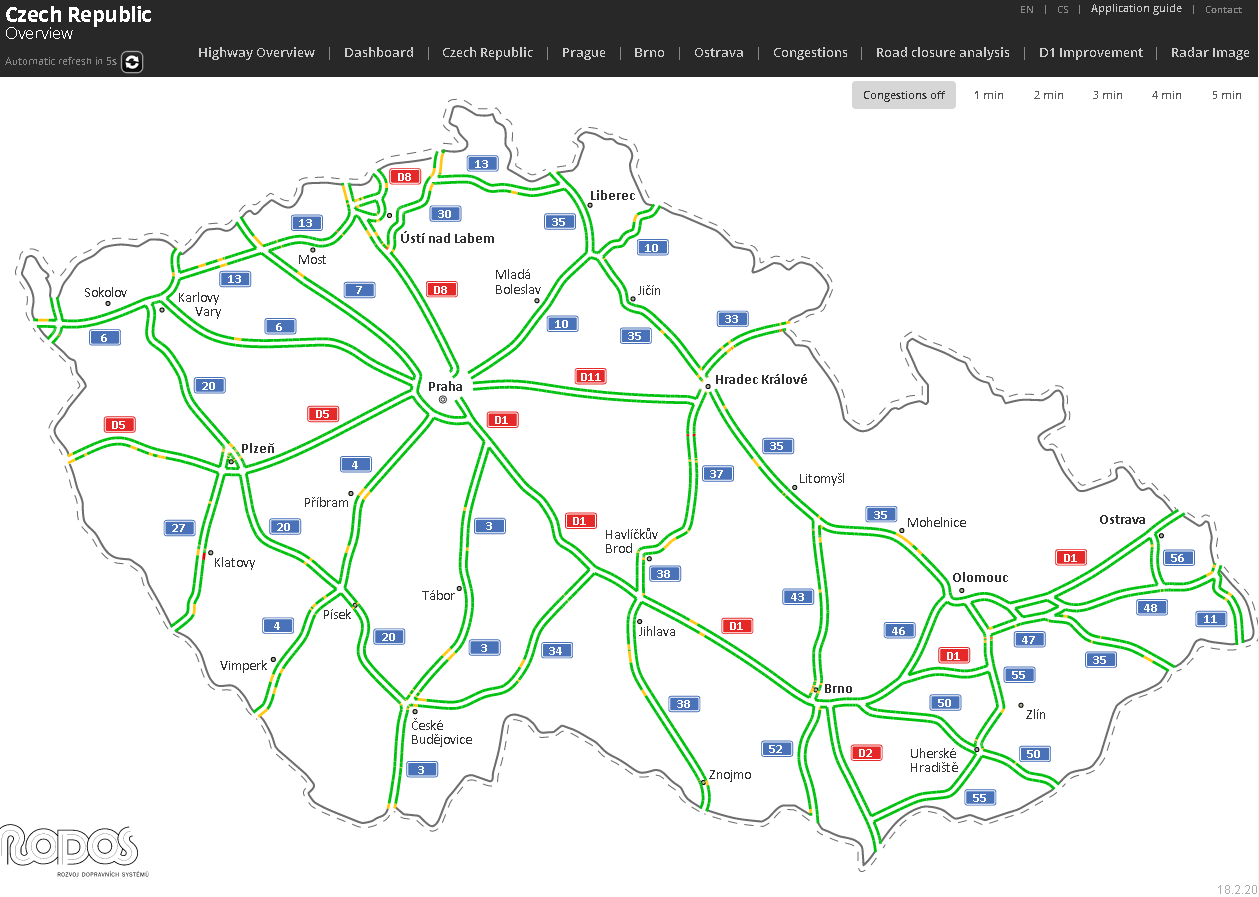
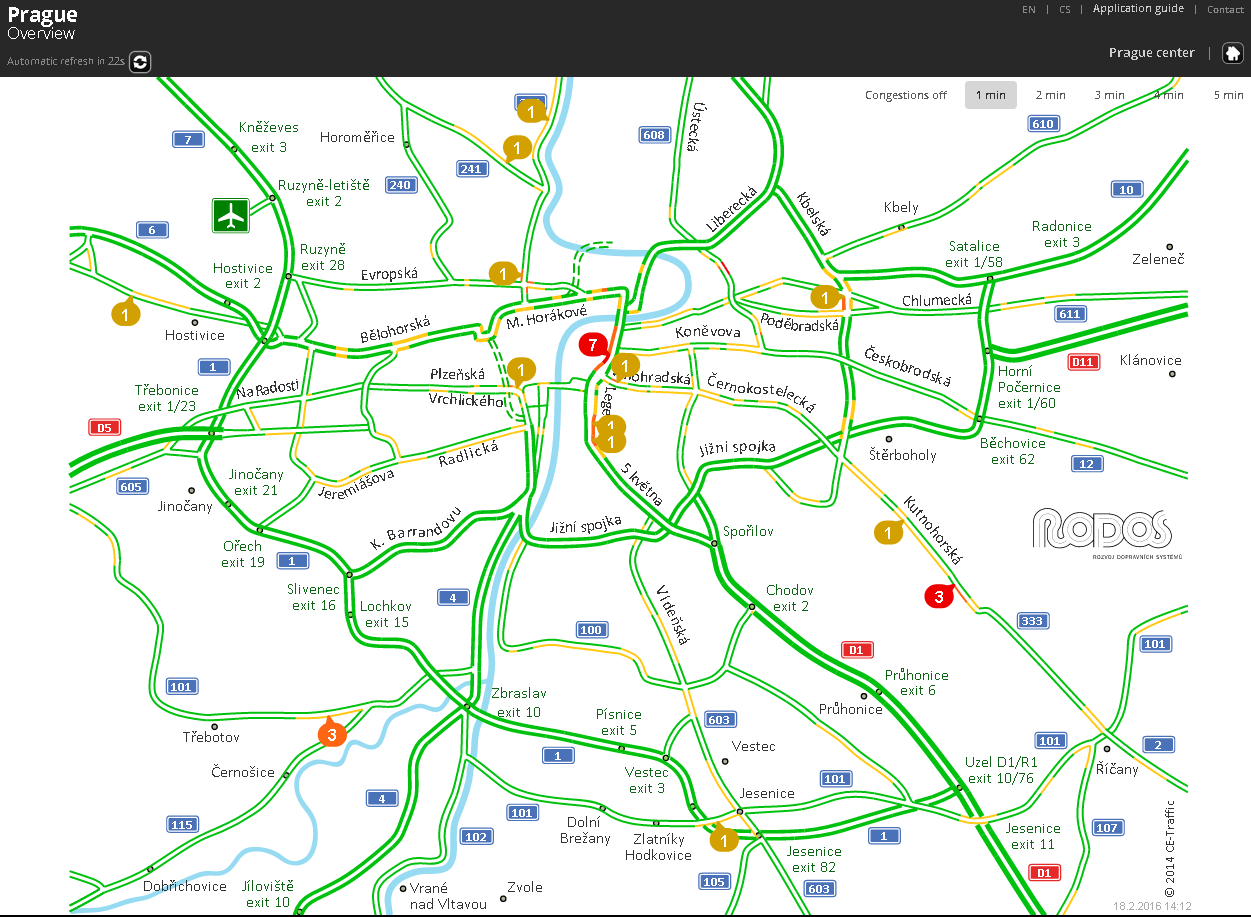
The visualisation of this data for end-user exploitation also faces a challenge: it is difficult to transform all the results and information into a format that can easily be digested by the public. The centre is able to provide nation or city schematic plans, automatic event identifications or television-friendly visualizations. By checking ViaRODOS anyone can have a real-time update of the current road system of the country or specifically for Prague, Brno, or Ostrava. You can check roads with 2-3-4 minute congestion, average speed of the traffic flow or see where maintenance is scheduled, and the delay caused in second precision.
This is the centre of Prague with the numbers indicating the minutes of congestion at that particular strip.
What does this mean?
It’s the knowledge economy where time is a scarce resource and we always have to be somewhere at any given point of time. In terms of mobility this means one simple statement: We want information and we want it now to enable us to move around more effectively. With RODOS, the Czech Republic is a leading example. And Big Data technology can have a leading role in driving this innovative initiative.
Originally posted at: http://www.big-data-europe.eu/the-czech-traffic-management-revolution-a-golden-opportunity-for-the-exploitation-of-big-data-technology/


