


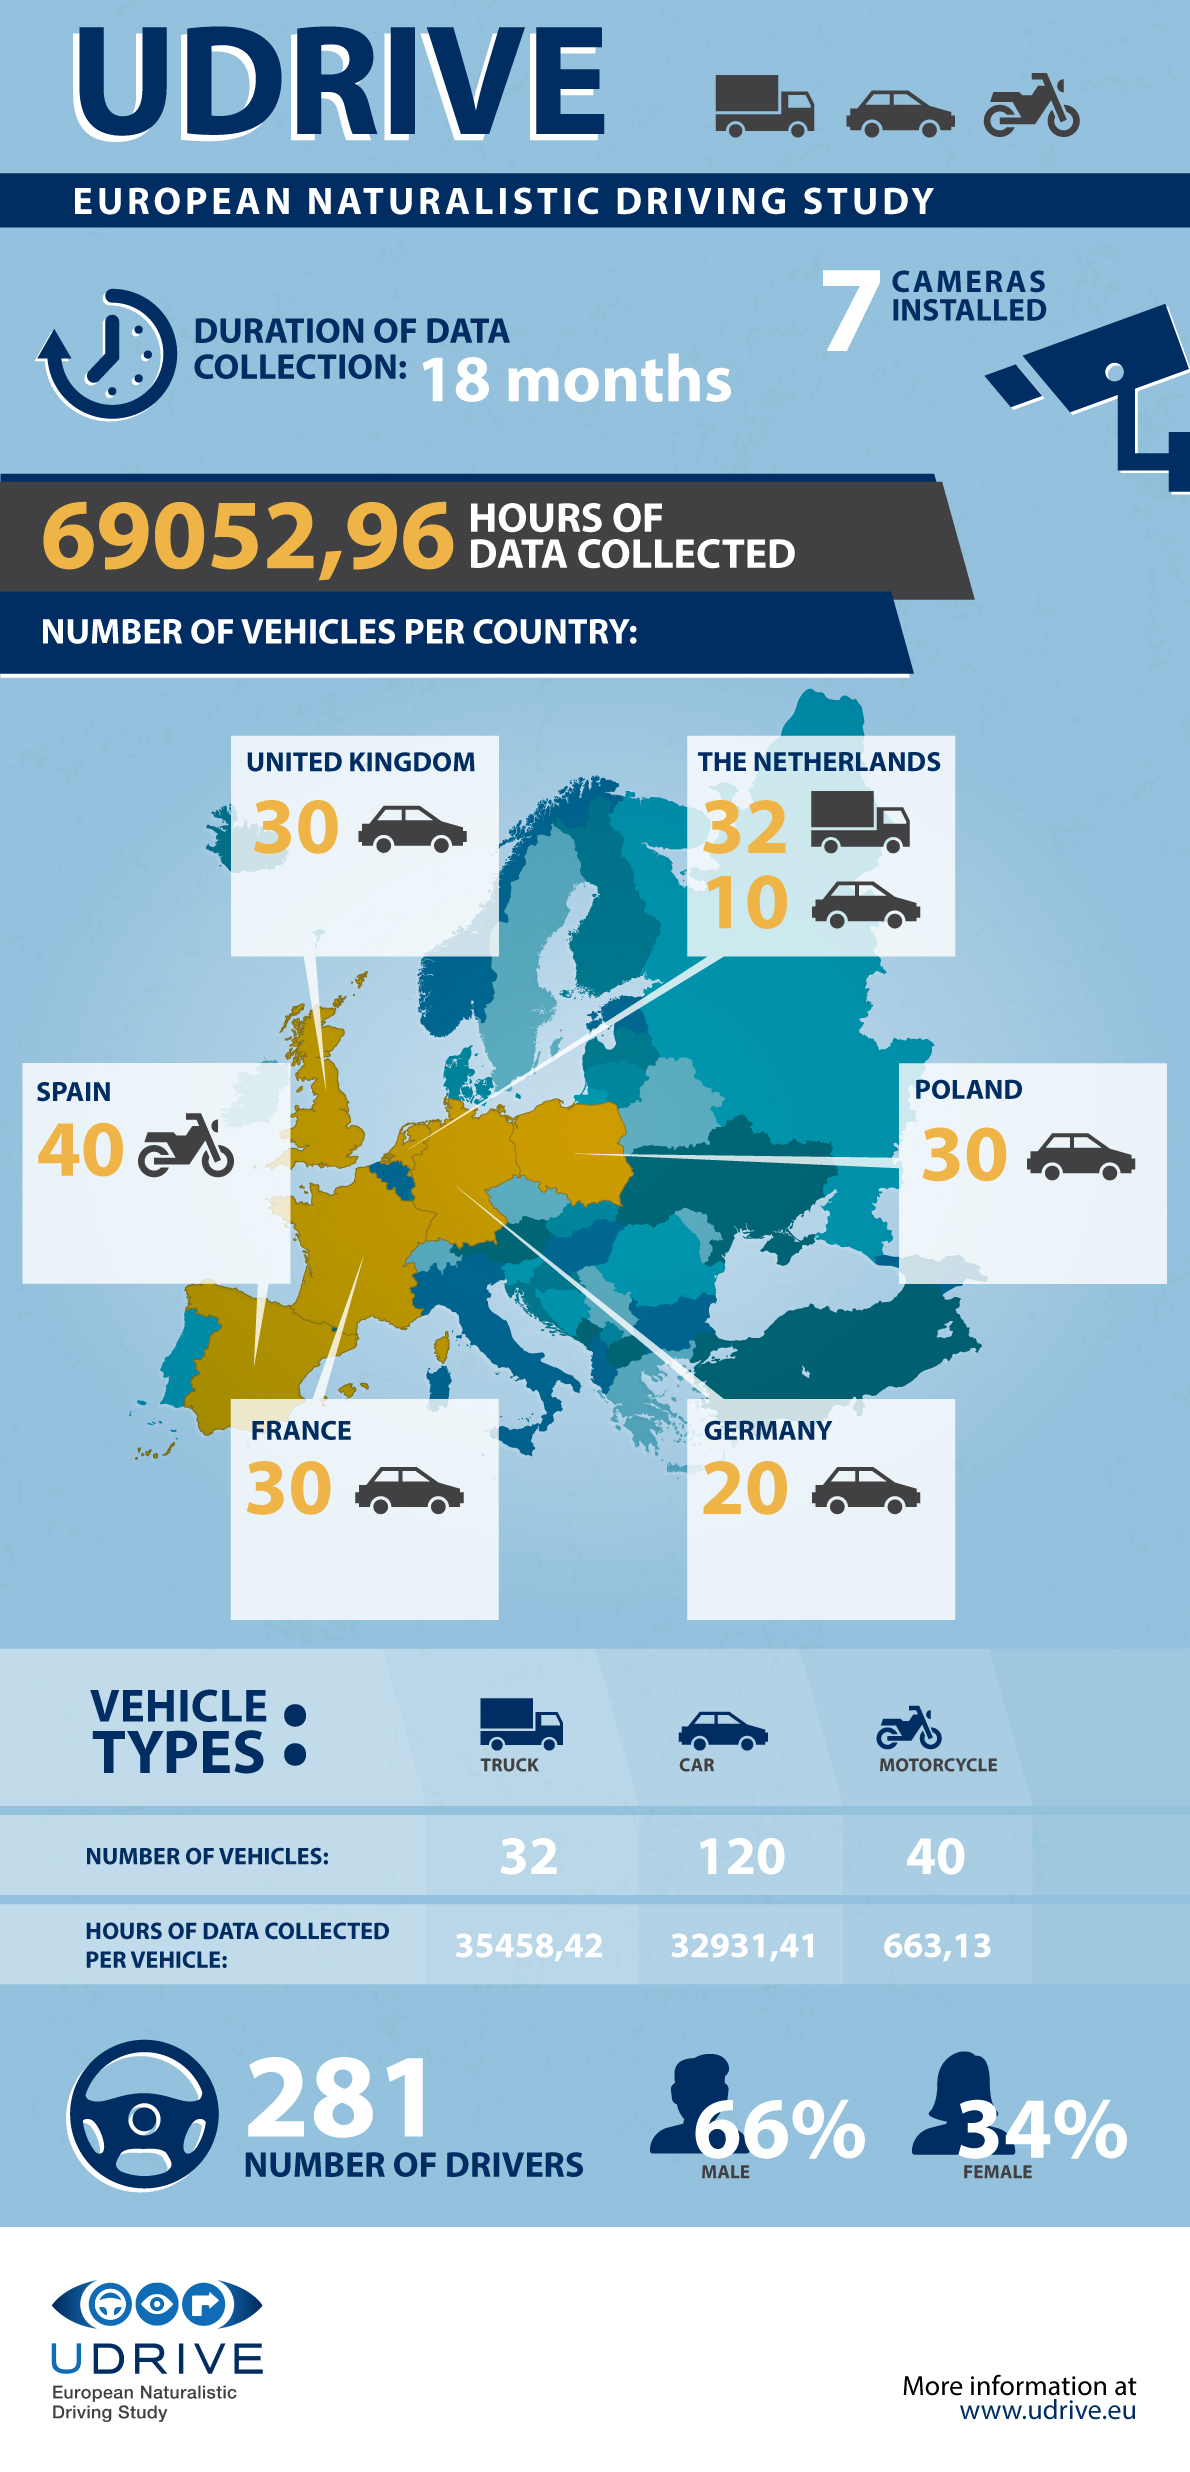
UDRIVE has created a new infographic showing the progress of data collecton in terms of hours, drivers and vehices in 6 different countries. The infographic will be updated with new data each month and published on the website.
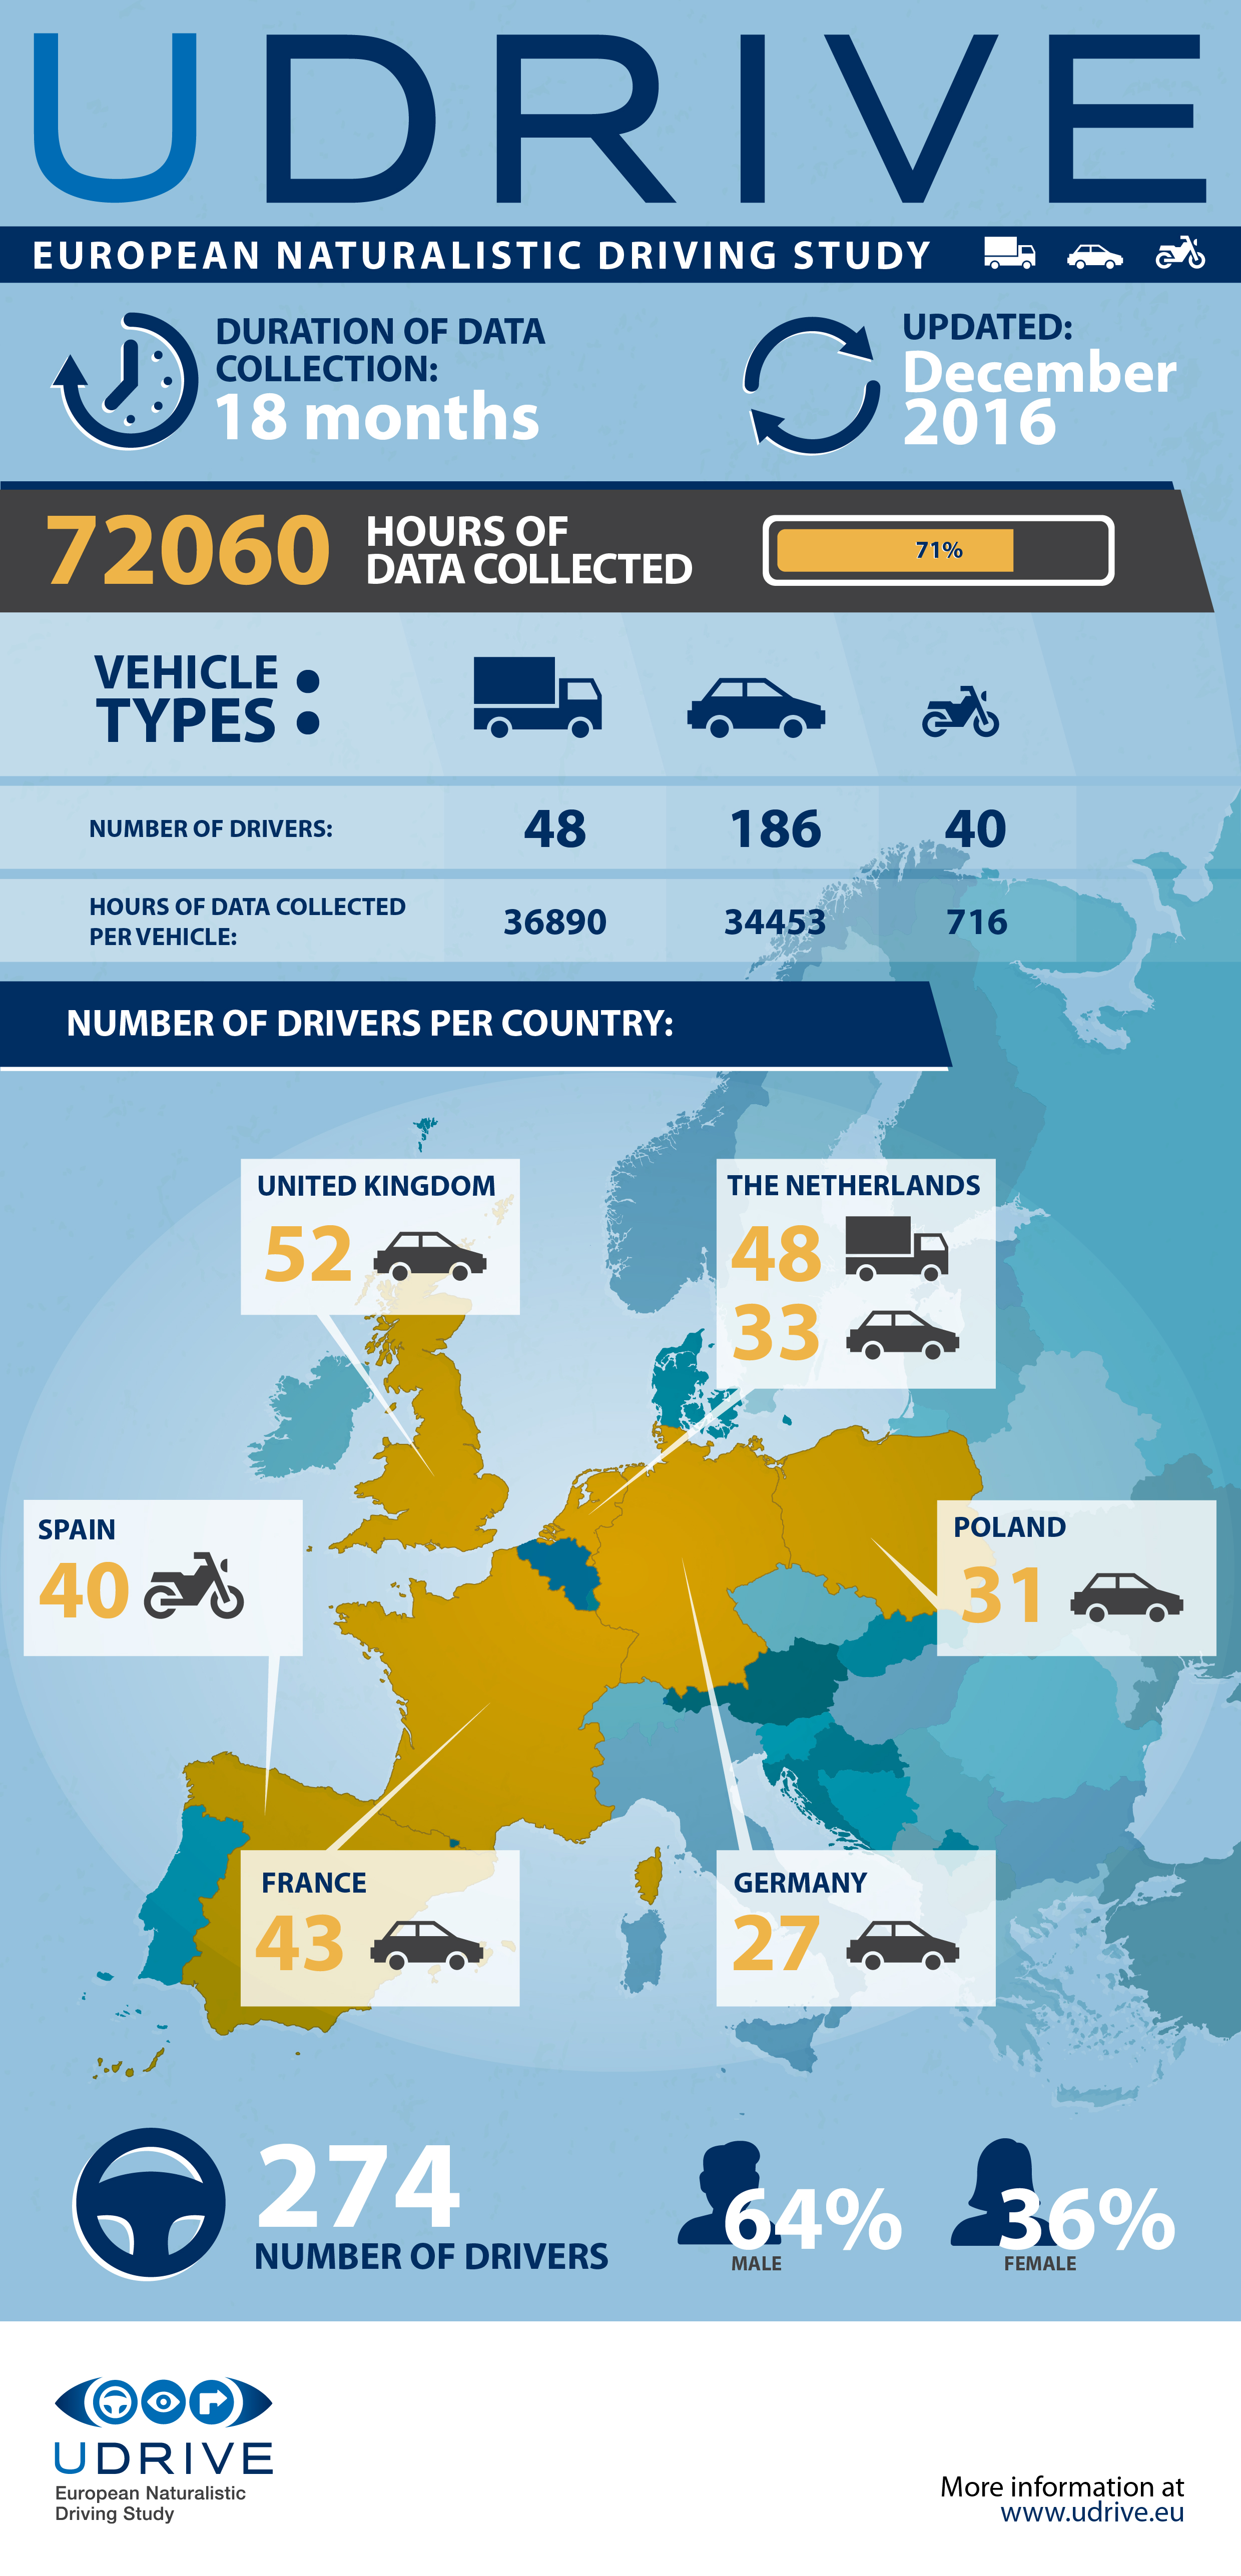
See the December 2016 Infographic below.
UDRIVE final results will be presented at the UDRIVE final event – the UDRIVE Experience, organised in conjunction with the 6th Naturalistic Driving Study Symposium from 7-9 June 2017 in The Hague, the Netherlands. For more information on the event, please visit the website.


