


International Transport Forum at OECD releases projections for modal shares, emissions at Lima COP20 conference
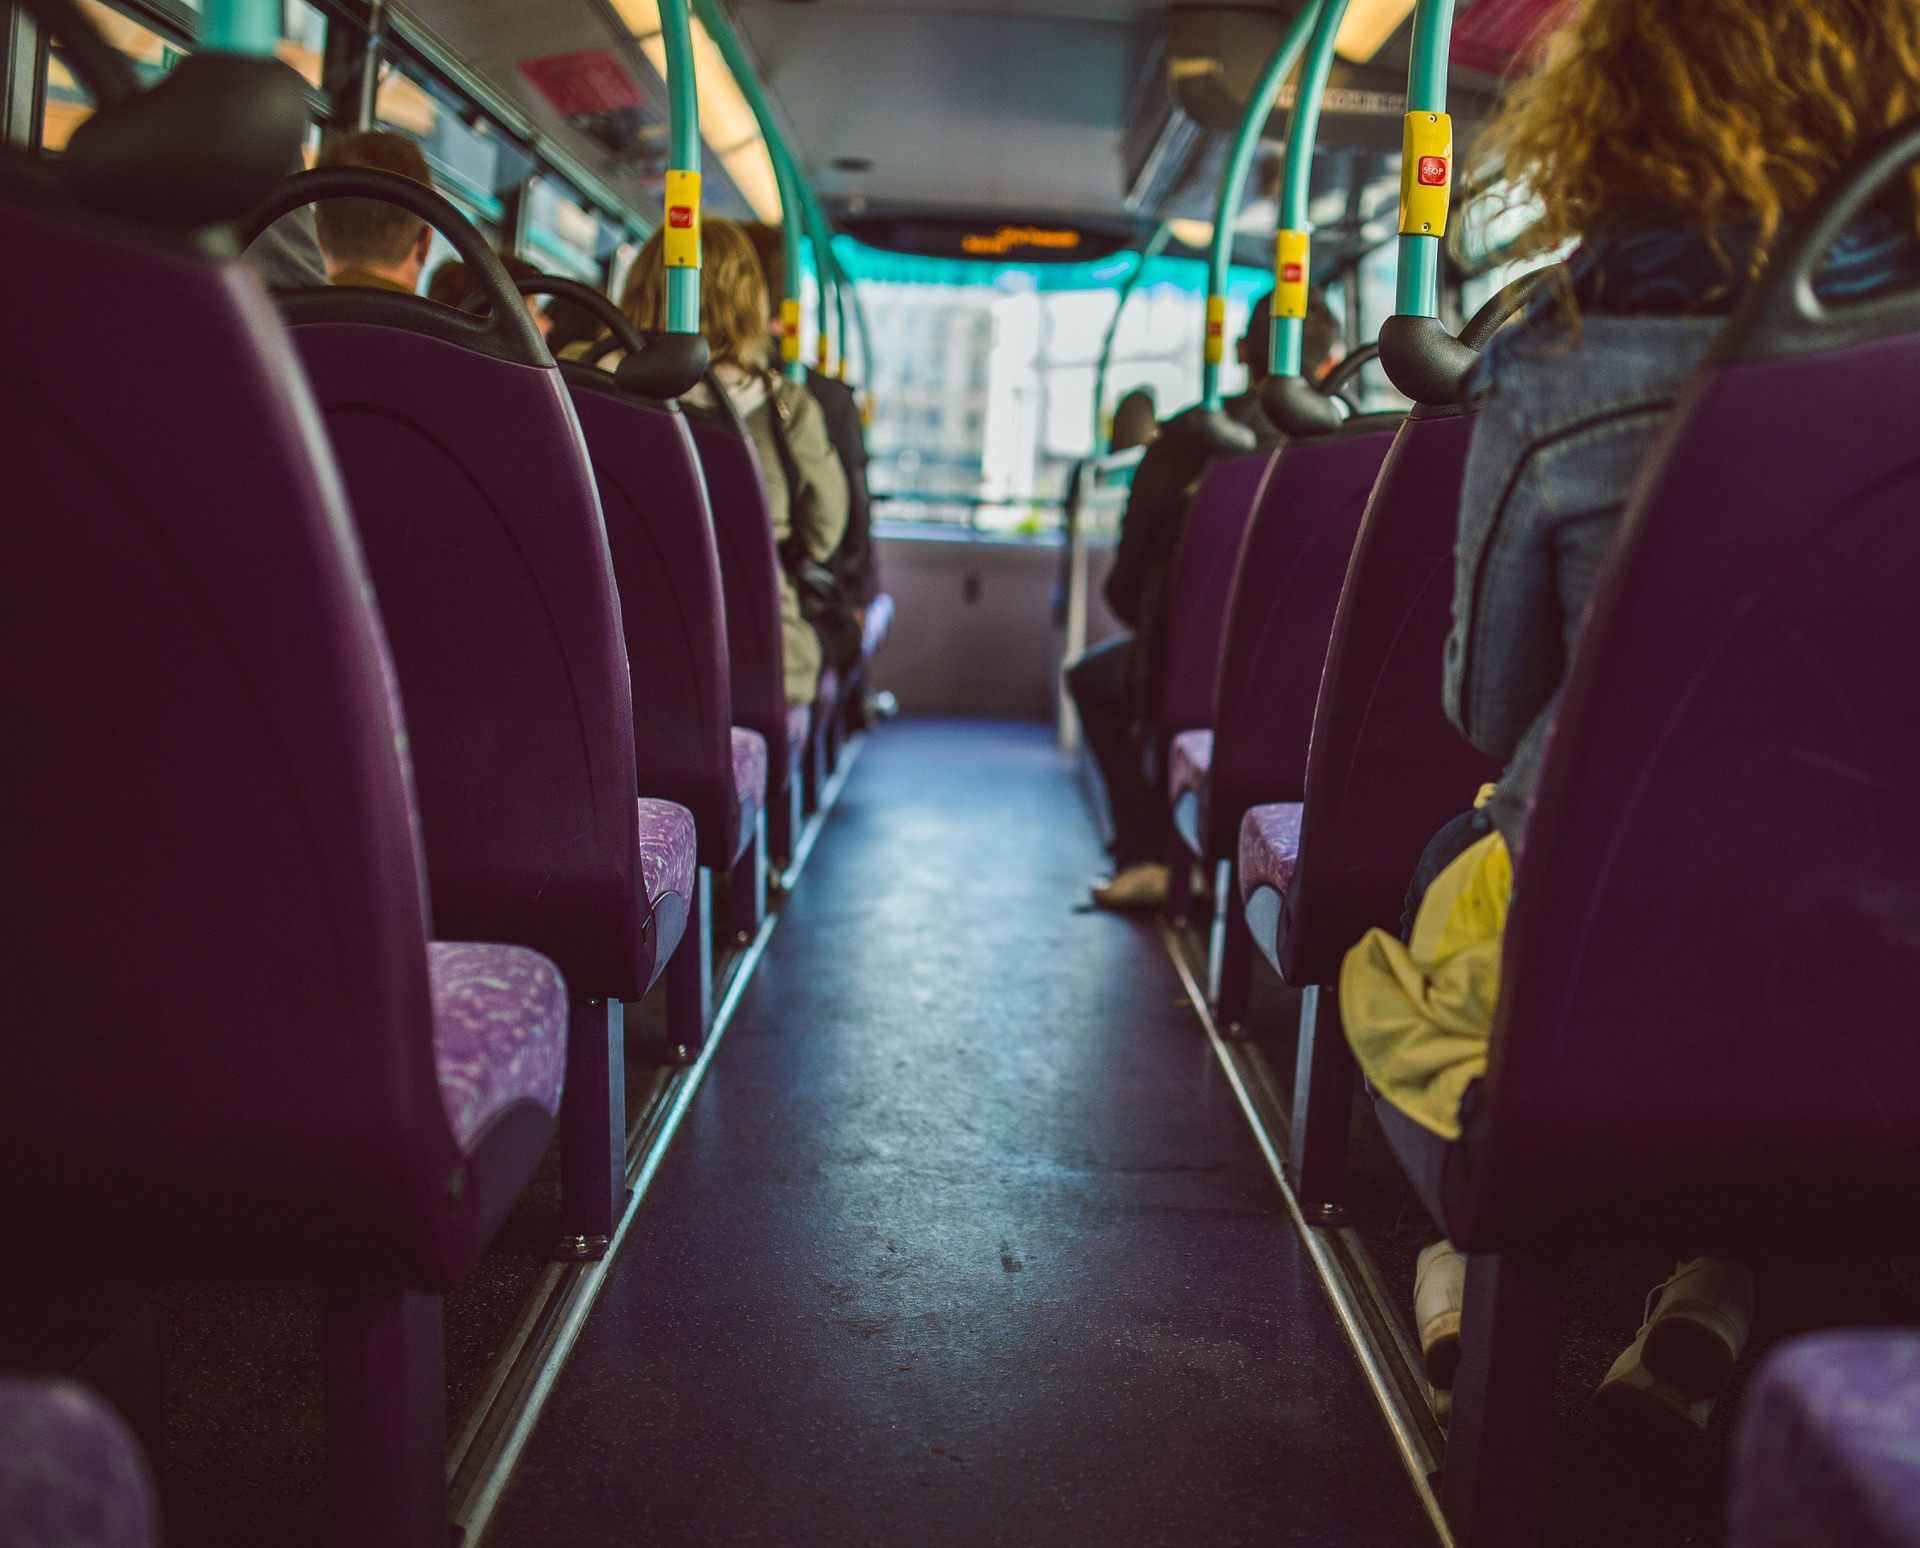
Transport in the urban centres of emerging economies is becoming a major battleground for combatting climate change.
Big cities in China, India and Latin America with over 500 000 inhabitants will more than double their share of world passenger transport emissions by 2050 to 20% (2010: 9%), if current urban transport policies remain unchanged. 38% of the total growth in world surface transport passenger emissions to 2050 will come from big cities in these three regions in such a business-as-usual scenario.
These new projections, released today by the International Transport Forum (ITF) at the OECD during the COP20 climate change negotiations in Lima, Peru, highlight a critical choice for policy makers: whether to pursue urbanisation based on public transport or on private transport with cars and two-wheelers.
Sustained policies that promote either private or public urban transport lead to very different mobility futures, as projections for modal shares in 2050 show (see chart 1 below):
In India,
u a private transport-oriented policy for cities would lead to two-thirds (67%) of urban mobility being covered by car traffic, with motorised two- and three-wheelers (17%, 5%) and public transport (11%) accounting for only a third;
u with pro-public transport policies, the share of buses and other public transport forms could be almost four times as high and reach 39% – practically on par with car travel (40%). Two- and three-wheelers would cover 12% and 9% respectively.
In Latin America,
u a public transport-oriented policy would result in a 50% share for public transport, 44% for cars, and 7% for two-wheelers in big cities.
u private transport-oriented policies would lead to an 82% share for cars, 11% for public transport, and 6% for two-wheelers.
In China,
u an urban policy with few new roads and stringent expansion in car ownership restrictions would lead to a 44% share for cars and a 34% for public transport; with two-wheelers taking 10%.
u in absence of these measures, cars would account for 78% of urban mobility, with two-wheelers representing 13% and public transport only 9% of the modal split.
These alternative scenarios have profound impacts for the contribution of urban transport to global emissions, according to the ITF projections (see chart 2 below):
u In India, policies that favour car use could increase emission growth by 47%. Policies that favour public transport could reduce it by 37% (see chart 1).
u In Latin America, policies that encourage private transport would add 35%, while public transport-driven urbanisation could reduce emissions growth by 31%.
u In China, emissions would grow by 19% above 2010 levels if cities were to support individual transport, but fall by 26% assuming a shift to public transport.
Understanding context, drivers, and effects of policies is crucial to achieving the desired results. For instance, if a ban on motorised three-wheelers in Indian cities reduced their number by 80% by 2050, this would lead to a mere 4% reduction in CO2 emissions as people switch to two-wheelers. Reduced mobility for others would impose a social cost.
The ITF Urban Transport Model now allows testing policies that focus on avoiding unnecessary mobility and shifting mobility to modes that emit less (“avoid-shift”), rather than on the effects of improved technology for emissions mitigation.
“One of the biggest challenges for a global mitigation framework is to encompass a wide range of coherent transport interventions while moving towards better methodologies for measuring, reporting and verification”, commented José Viegas, Secretary-General of the International Transport Forum at the OECD.
“It is desirable that countries develop their mitigation actions as part of a wider urban sustainable policy strategy instead of expecting all other externalities to be automatically reduced as a co-benefit of CO2 mitigation.”

Chart: Impact of alternative policies on urban mobility
The ITF Urban Transport Model
· The ITF Urban Transport Model was developed as part of the ITF Transport Outlook, a study that develops scenarios for transport demand to 2050.
· It simulates the evolution of variables that shape transport demand in urban areas with 500 000 inhabitants or more. Among these are not only population growth and economic activity, but also variables such as fuel prices, land use, availability of roads, quantity and quality of public transport. For the latter four, various policy scenarios are tested.
· The model derives levels of transport activity and modal shares that would result in each scenario – e.g. for policies that favour public transport, or for declining fuel prices.
· The model is composed of regional modules for urban areas in Latin America, China and India. The regional approach provides the flexibility to use the available urban transport data of each region. It allows to set relations between variables according to the specific trends found in each region, e.g. car restrictions that exist in China.
· Based on this, the ITF Urban Model can test what long-run impact different urban transport policy packages could have if they were adopted as sustained regional strategy.
· Data for Latin America: Urban Mobility Observatory of the Latin American Development Bank (CAF), Mass Transit Database of the Institute for Transportation and Development and Studies (ITDP), EMBARQ reports on Bus Rapid Transit (BRT), government sources
· Data for India: The Energy Resources Institute (TERI), Indiastat, ITDP Mass Transit Database.
· Data for China: China Statistical Yearbook, Dr. Hua Zhang (Tongji Univ.), Dr. Hao Tan (Tsinghua Univ.), Dr. Cherry and Dr. Ling (Univ. of Tennessee-Knoxville), Dr. Li (Boston Region Metropolitan Planning Organization) and the IDTP Mass Transit Database.
· Assumptions on load factors, fuel economy and CO2 emission factors come from the MoMo mobility model of the International Energy Agency (IEA).
Air pollution and health impacts that would result from the different transport activity scenarios are calculated by the International Council for Clean Transportation (ICCT).


